
Portfolio
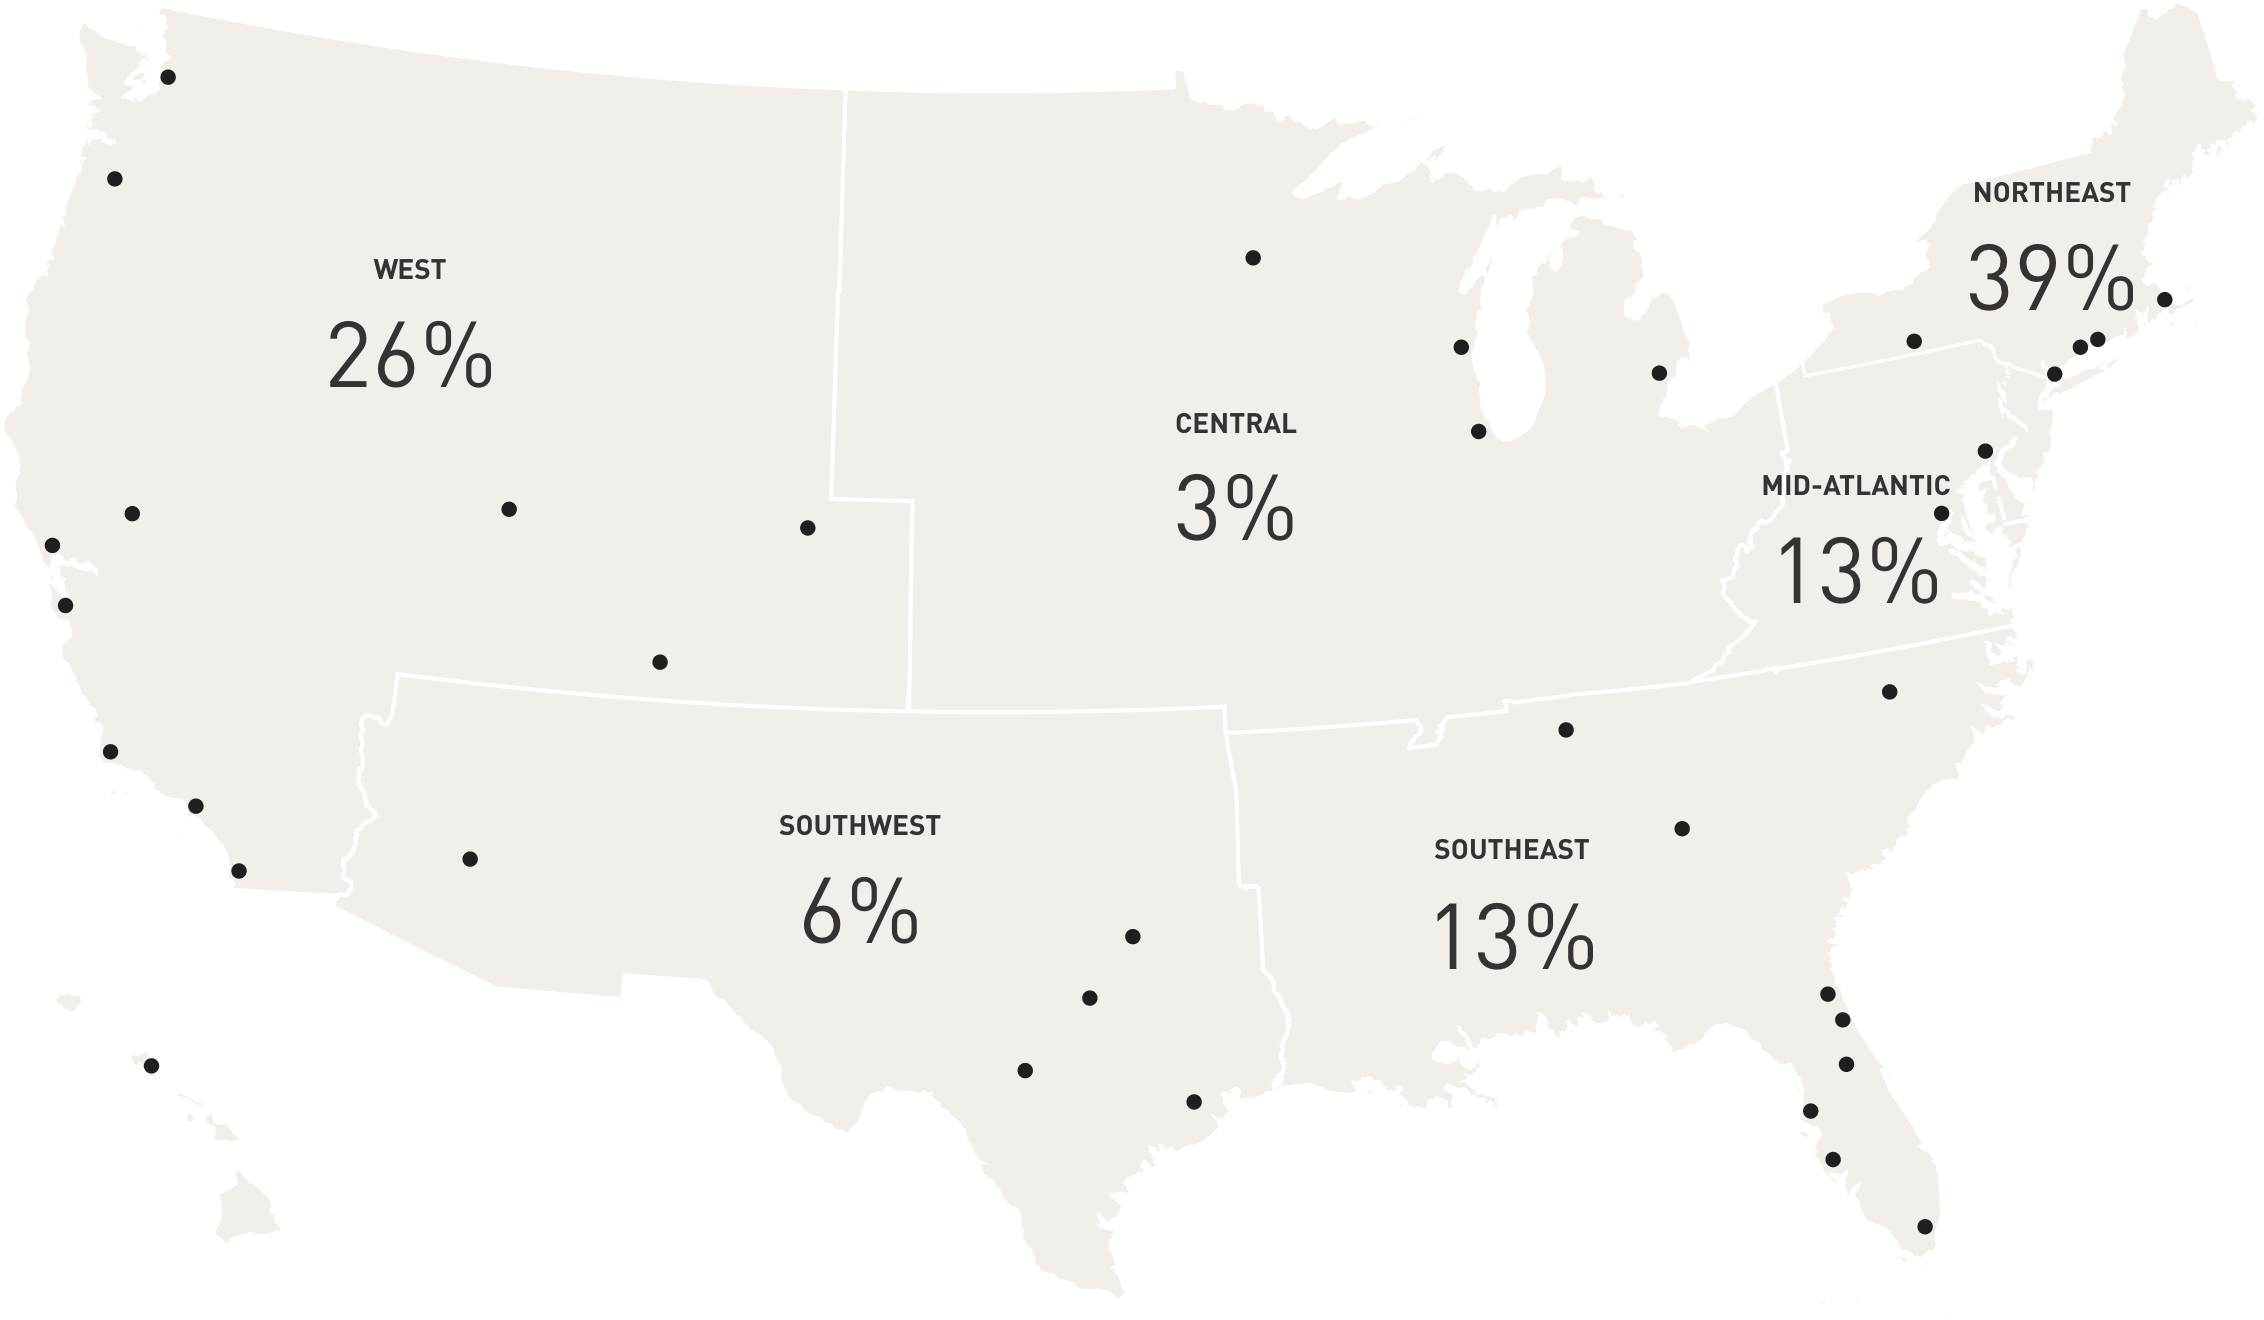
Safehold’s portfolio has increased 18x since IPO in June 2017 to $6.2 billion.(1)
(1) The portfolio is presented using Aggregate Gross Book Value. As of 12/31/22, the portfolio included $308m of forward commitments that have not yet been funded (such funding commitments are subject to certain conditions). There can be no assurance Safehold will fully fund these transactions.
West
- Seatle
- Portland
- Salt Lake City
- Denver
- San Francisco
- Sacramento
- San Jose
- Los Angeles
- San Diego
- Honolulu
Southwest
- Phoenix
- Dallas
- Austin
- San Antonio
- Houston
Southeast
- Raleigh-Durham
- Nashville
- Atlanta
- Jacksonville
- Orlando
- Tampa
- Sarasota
- Miami
Central
- Minneapolis
- Milwaukee
- Detroit
- Chicago
Mid-Atlantic
- Philadephia
- Washington, D.C.
Northeast
- New York
- Boston
Yield Metrics
5.1%
Annualized Yield
($301m Annualized In-Place Net Rent)
3.4%
Annualized Yield
($192m Annualized In-Place Cash Rent)
Credit Metrics(1)
3.9x
W.A. Rent Coverage
40%
W.A. GLTV
Property Type
36% Multifamily
(69 Assets)
(69 Assets)
12% Hotel (16 Assets)
4% Life Science (5 Assets)
3% Mixed Use & Other
(5 Assets)
(5 Assets)
45%
Office
(36 Assets)
Office
(36 Assets)
Underlying Property(131 Assets)
Lease Term
94%
>60 yrs
>60 yrs
4%
<20 yrs
<20 yrs
2%
20-60 yrs
20-60 yrs
Lease Term
Remaining W/ Ext.(W.A. 91 Years)
Remaining W/ Ext.(W.A. 91 Years)